Home » Commercial Property Market » Sydney
Sydney Commercial Property Market
Quarterly market insight on Sydney commercial property — vacancy rates, yields, precinct conditions, deal flow and more.

Current market conditions in Sydney
Jan - Mar 2026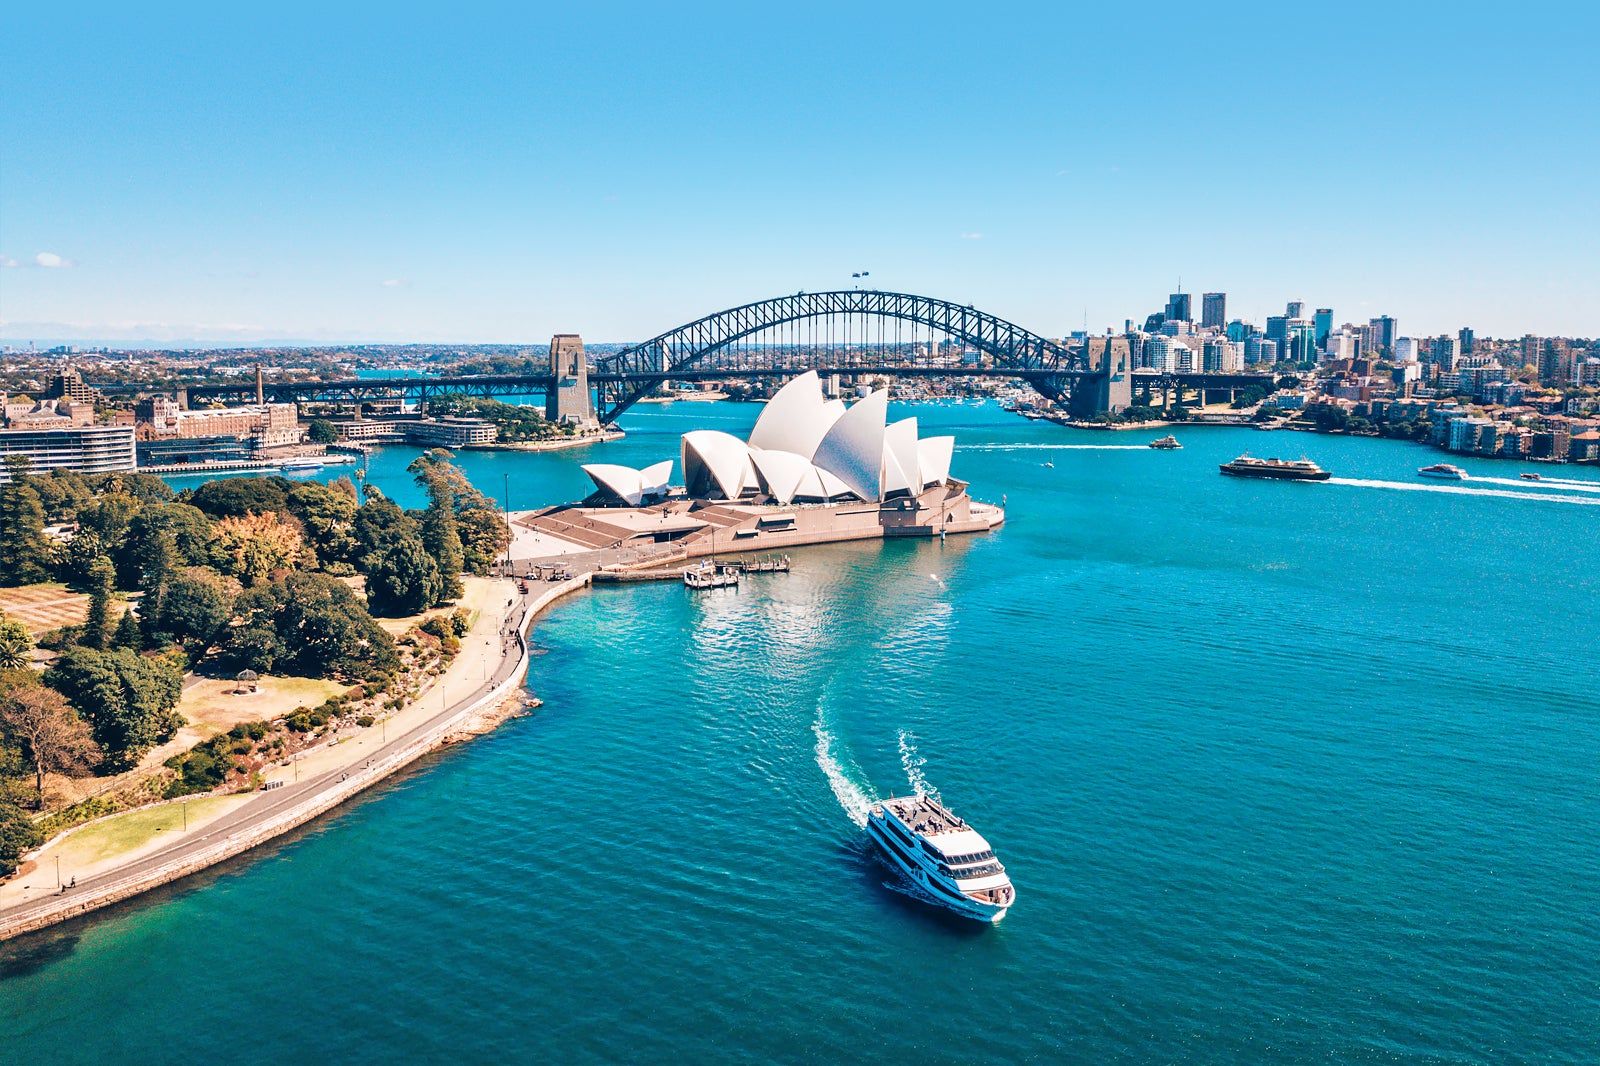
The dominant theme across Sydney in Jan - Mar 2026 is renewed owner-occupier confidence — particularly in the sub-$3M range across healthcare and professional services. Businesses that were watching from the sidelines through 2024 are moving forward with acquisitions. Transaction activity in this segment is the strongest I’ve seen since early 2024, and well-presented assets in the right precincts are generating genuine competition between buyers.
Industrial continues to be the standout sector. Well-located assets in the south-western and outer-western corridors are transacting with confidence — tight vacancy, strong tenant demand and no meaningful supply pipeline make this the most consistent-performing commercial category in the Sydney market right now. The quality bifurcation in CBD office is stark: prime assets with committed long-term tenants are performing well, while secondary and strata-grade stock faces ongoing pressure on both rents and valuations that is showing up in transaction outcomes.
Sydney commercial property market pulse
Jan - Mar 2026How each sector is performing shapes who’s buying, at what price, and on what terms. These observations come primarily from active Sydney transactions by Nadine Connell
Broker observations — Nadine Connell, Smart Business Plans · smartbusinessplans.com.au
Tightest conditions on the panel. Well-located south-western and outer-western corridor assets attract genuine lender competition. Owner-occupier demand is the primary driver of volume — the cleanest finance category in Sydney right now.
Strong tenant covenant driving improved confidence. Active SMSF interest in dental, allied health and GP precincts. One of the more competitive sectors for specialist lenders currently.
Anchor-tenanted strip retail attracting improved appetite. The market has split sharply — essential-service retail performing well while discretionary and regional centres remain out of favour.
Lender pool smaller than pre-2023. Prime assets with long WALE are getting done — strata and secondary grade require careful lender matching and realistic valuation expectations.
Pre-sales requirements remain firm. Track record matters more than asset quality. Well-capitalised developers with proven delivery are accessing competitive terms.
For lending rates, LVR ranges and lender panel detail by sector, see our Sydney commercial property loans page.
Sydney vacancy rates
CBD office & industrial — the two most actively tracked sectors for Sydney commercial property investors.
Vacancy rates are the leading indicator for where rents and yields are heading next. In Sydney’s commercial market, the two sectors that move independently of each other — and in opposite directions — are CBD office and industrial logistics. Understanding both is essential context for any acquisition decision in this market.
Vacancy data sourced from Property Council of Australia Office Market Report (CBD office, 6-monthly) and CBRE Industrial & Logistics Quarterly Report (industrial, quarterly). Broker commentary represents personal observations from active commercial finance transactions and does not constitute investment advice.
Sydney commercial property yields & cap rates
Broker-observed yield midpoints across five sectors — reviewed and updated each quarter.
Yields reflect the income return on a commercial property relative to its purchase price. These figures are broker-observed midpoints from active Sydney transactions — they represent the range where the majority of deals are transacting, not the absolute limits of what the market can produce.
Broker-observed midpoints — Nadine Connell, Smart Business Plans · smartbusinessplans.com.au
The widening gap between industrial and CBD secondary office yields is the defining story in Sydney’s commercial market right now. Industrial at 5.25%–6.50% reflects genuine investor competition and tight supply — buyers are paying premium pricing because the underlying fundamentals support it. CBD secondary office at 7.25%–9.00% is the opposite: wider yields are a market signal of risk, not value, and lenders are reading that signal clearly.
Medical and healthcare is the sector worth watching. Yields have been compressing steadily as SMSF buyer demand — particularly for dental, allied health and GP tenanted properties — continues to drive competition. For buyers who can identify well-tenanted healthcare assets before that compression fully plays out, the timing window is narrowing.
Yield figures represent broker-observed midpoints from active commercial finance transactions in Sydney and are directional indicators only — not a statistical index. Individual asset yields vary based on location, lease terms, tenant covenant, building grade and other factors. This data does not constitute financial or investment advice. Always obtain independent valuation and professional advice before making any property investment decision.
Sydney commercial property market by precinct
Jan - Mar 2026Sydney is not a single commercial market. Conditions in Western Sydney industrial are fundamentally different from the CBD, North Sydney or Parramatta — and those differences shape what lenders will do, what valuers will find, and what your asset is worth. Select a precinct below for current market conditions. For LVR ranges and lender panel detail, see our Sydney commercial property loans page.
CBD & City Fringe
Selective
Office & mixed-use
The headline vacancy number understates the quality split. Premium freehold with committed long-term tenants is performing strongly — prime net rents holding at $900–$1,100/sqm and institutional buyer demand intact. Strata and secondary grade is a different market: valuations are coming in short on a meaningful number of transactions, incentive packages remain elevated, and the lender pool is narrower than at any point since 2019.
Two major premium supply additions due in 2027 (55 Pitt Street and Chifley South) will add approximately 125,000 sqm of premium NLA and maintain headline vacancy above historical average in the near term. For finance, this is the Sydney precinct where lender selection matters most — the same asset on the wrong lender’s books produces a valuation shortfall that the right lender avoids entirely. CBD strata office: build in an equity buffer. Premium freehold with strong tenants: competitive conditions remain.
North Sydney & North Shore
Improving
Office
The most significant market turnaround story in Sydney right now. Victoria Cross Metro opened August 2024 and the impact on tenant enquiry was immediate — this is a materially different market to 12 months ago. Headline rents of $550–$680/sqm sit 25–35% below CBD rates with high incentives, making effective rents genuinely competitive for cost-sensitive tenants relocating from the CBD.
Strata office more active here than any point in the past 18 months. The North Sydney Metro Quarter development (delivering 2026–27) will add activated ground-floor retail and hospitality directly above Victoria Cross station, addressing the primary occupier criticism of the precinct. In my active submissions, lender confidence in North Sydney has improved markedly — the precinct’s trajectory has shifted in a way that is now reflected in credit decisions.
Parramatta & Greater West
Strong
Office
The tightest non-CBD office market in Australia by vacancy rate. Sustained government, health and professional services demand has held vacancy in a tight band through the rate cycle. Prime rents of $440–$520/sqm offer genuine value relative to CBD alternatives, particularly for tenants relocating operations westward.
Metro West (Parramatta station expected ~2028) is already influencing investor interest — the catchment case strengthens materially on opening. Broad lender interest across office, strata, service commercial and medical. Of all Sydney office precincts, Parramatta presents the most consistent lending conditions across my panel — this is where I see the fewest credit surprises.
Western Sydney Industrial
Strong
Industrial & logistics
Western Sydney Airport (opening late 2026) is already generating freight and logistics pre-commitments in the Aerotropolis precinct — operators are committing to sites they won’t occupy for 18–24 months. The south-western and outer-western logistics corridors — Ingleburn, Prestons, Horsley Park — remain the most lender-competitive industrial category on my panel.
Well-located functional assets in the right sub-precincts are achieving 65–70% LVR from multiple lenders simultaneously with minimal friction. The nuance here is that there is a meaningful difference between the established logistics corridors and the outer speculative edge — lenders see that distinction directly, and the LVR and pricing reflect it.
South Sydney & Inner West
Strong
Industrial (infill)
The tightest industrial precinct conditions of any Australian market. There is effectively no supply pipeline — the combination of geographic constraints, zoning, and existing density makes new industrial land impossible to create here. Every available asset generates competition from both investors and owner-occupiers.
Prime rents of $220–$300/sqm are the highest of any Sydney industrial precinct. Valuations are actively supported by market evidence and lender confidence is strong. For strata industrial, owner-occupier purchasers are often competing with investors for the same stock. This is the cleanest finance category I work in across the entire Sydney market — when the asset is right, the lender competition is real.
Eastern Suburbs
Selective
Medical, healthcare & boutique office
Premium location does not translate automatically to depth of lender appetite. Medical and practitioner-owned assets — dental, allied health, GP precincts across Bondi Junction, Randwick and surrounds — are performing strongly with active SMSF demand and tight yields. Dedicated healthcare lending programmes are available for qualifying owner-occupying practitioners throughout this corridor.
Boutique office and retail require site-specific assessment. The postcode commands a premium in the occupier market that doesn’t always carry through to lender appetite or valuation. Non-anchor retail remains cautious across most eastern suburbs positions. If you are a practitioner buying in this precinct, the lender I approach first is not a standard commercial bank — and the distinction typically means a materially better outcome.
Precinct observations represent Nadine Connell’s personal experience from active commercial finance transactions. Reviewed Jan - Mar 2026. Not financial or investment advice. · View lending criteria and LVR ranges by precinct →
Sydney development pipeline
Major projects shaping Sydney’s commercial property landscape through to 2028. Click any pin for project detail.
Infrastructure
✓ Complete
Victoria Cross Metro Station
North Sydney · Opened Aug 2024
Direct link from North Sydney to Barangaroo and Martin Place. Measurably improving office tenant enquiry in North Sydney from the month of opening. Reshaping the catchment case for North Sydney as a CBD alternative. Part of the $16.8B City & Southwest Metro.
Industrial
● Delivering
Aerotropolis Business Park — Stage 1
Western Sydney · 2025–2026
Part of $10B+ Aerotropolis Special Economic Zone. First purpose-built logistics and light industrial land releases adjacent to the new airport. Pre-commitments from major freight and e-commerce operators already secured.
Infrastructure
○ Late 2026
Western Sydney International Airport
Badgerys Creek · Late 2026
$11.7B+ federal / state project. Largest commercial land release in Sydney’s history in the surrounding Aerotropolis precinct. Already driving industrial pre-commitments within a 15km radius.
Office
○ Q4 2026
Atlassian HQ — Tech Central
Eveleigh · 39 floors · ~40,000 sqm NLA
Anchor for the Tech Central innovation precinct. Estimated 10,000+ technology workers on-site. Driving commercial and mixed-use activity in the surrounding Redfern and Eveleigh fringe market.
Mixed-use
○ 2026–27
North Sydney Metro Quarter
North Sydney · ~35,000 sqm office NLA
Integrated precinct development directly above Victoria Cross Metro. Retail and hospitality activation at ground level — addressing the primary occupier criticism of North Sydney.
Office
○ 2027
55 Pitt Street (Mirvac)
Sydney CBD · 40 floors · ~75,000 sqm NLA
Premium replacement supply. Pre-committed major financial services tenants. 6 Star Green Star. With Chifley South adds ~125,000 sqm premium supply to CBD by end of 2027 — continuing the flight-to-quality dynamic.
Office
○ 2027
Chifley South (Dexus)
Sydney CBD · ~50,000 sqm NLA
Premium addition expanding the established Chifley precinct. Part of the broader CBD flight-to-quality dynamic where premium assets absorb while secondary-grade continues to face vacancy pressure.
Infrastructure
○ 2026–2030
Sydney Metro West
CBD to Parramatta · $25B · 8 stations
Stations at Westmead, Parramatta, North Strathfield, Burwood North, Five Dock, The Bays, Hunter Street and Sydney CBD. Parramatta station will further deepen the already-strong western Sydney office market.
Project details and completion dates sourced from publicly available developer, government and industry announcements. Figures are estimated targets subject to change. Not financial or investment advice.
Sydney deal flow & valuations
Jan - Mar 2026Where transactions are happening
Transaction volume in the sub-$5M Sydney commercial market has been improving since mid-2025. The rate-cut cycle has had a meaningful impact on owner-occupier confidence — businesses that were watching the market through 2024 are now moving forward with acquisitions, particularly in the $1M–$3M range across healthcare, professional services and light industrial.
Investment activity is more selective. Buyers are active in sectors where the yield story is clear — industrial, medical, anchor-tenanted retail — and cautious where the income outlook is less certain. The quality bifurcation within sectors is striking: a well-located, well-tenanted CBD office asset and a secondary strata suite one suburb away are attracting very different buyer and lender pools.
Valuation watch
Valuations are the most significant variable in Sydney commercial finance outcomes right now. A strong property with a strong borrower can still produce a shortfall if the valuation doesn’t support the purchase price.
Valuations coming in short in a meaningful number of transactions. Build in an equity buffer or be prepared for a lower LVR than initially discussed.
Valuer conservatism on non-essential retail continues. Market rent assumptions are cautious. Expect LVR pressure on standalone retail without strong tenant covenants.
Valuations generally tracking at or above purchase price. Strong market evidence supporting lender confidence. Minimal shortfall risk for well-located functional assets.
Valuer confidence in healthcare assets remains strong. Market evidence consistent and supportive. Minimal shortfall risk for well-located, tenanted medical assets.
Broker observations from active Sydney commercial finance transactions, Jan - Mar 2026. Not financial or investment advice.
Sydney commercial property — frequently asked questions
Questions I answer regularly from clients approaching the Sydney market for the first time, or returning after time away.
What is the current Sydney CBD office vacancy rate?
The current figure is in the vacancy tracker above, sourced from the Property Council of Australia Office Market Report. What that number tells you is only part of the story, though — and importantly, the rise in Sydney CBD office vacancy is primarily supply-driven rather than demand-driven. New premium-grade stock has been delivered into the market while underlying tenant demand has held relatively steady.
That said, the Sydney office market has split sharply between asset grades. Premium and A-grade assets with committed tenants are performing well and attracting a healthy lender pool. Secondary and strata-grade office, on the other hand, faces sustained pressure on both rents and valuations — and that pressure is showing up directly in finance outcomes.
In practice, what this means for buyers is a narrower lender pool for non-prime CBD office assets and the need for careful lender matching based on asset quality, lease profile and location within the CBD. This is not a market where you can assume the first lender you approach will be the right one.
What are typical commercial property yields in Sydney?
First thing to remember: commercial property yields in Sydney are the most compressed of any Australian capital city. That compression reflects the depth of investor demand, the scarcity of quality inner-precinct assets, and the premium the market places on liquidity. In other words, you pay more per dollar of income here than you would for a comparable asset in Brisbane or Perth — and that’s a deliberate trade-off, not an oversight.
Current sector-by-sector yield ranges are in the yield tracker above, reviewed quarterly from active transactions across my lender panel. Those figures are directional midpoints — not a formal index — and vary by precinct, lease term, tenant covenant and asset quality. As a general rule, medical and industrial assets attract the tightest yields; CBD strata office sits at the wider end of the range.
For lending purposes, it’s equally important to understand that lenders apply their own capitalisation rate assessments as part of the valuation process. A deal that appears to work at an acquisition yield can quickly become difficult if the lender’s valuer applies a wider cap rate in their assessment. I see this trip buyers up more often than almost any other single issue.
Why is Sydney industrial vacancy so low?
Current vacancy figures are in the tracker above. To put those numbers in context, economists generally consider 4% to be the equilibrium threshold for a balanced market — Sydney industrial has been running well below that for some time, and the structural reasons behind it aren’t going away soon.
Two factors are driving this. First, e-commerce demand for last-mile logistics in a geographically constrained city means that inner-ring industrial land simply can’t be replaced once it’s gone. Second, freight and logistics operators are making pre-commitments around Western Sydney International Airport (Badgerys Creek, opening late 2026), absorbing future supply before it’s even built. South Sydney infill precincts are the tightest in the country as a result.
For investors and lenders alike, the result is a highly favoured asset class. Valuations are well-supported, lender confidence is strong, and quality industrial assets in the right precincts are attracting genuine competition from multiple lenders on the panel. In my experience, industrial is currently the most straightforward commercial sector to finance in Sydney — provided the asset and structure are right.
How does the Sydney commercial property market compare to Melbourne and Brisbane?
Sydney commands the lowest commercial property yields of any Australian capital city, reflecting the depth of demand and a distinct liquidity premium. Compared to Melbourne, CBD office vacancy rates are broadly similar — both markets are navigating elevated supply. Brisbane and Perth, on the other hand, have seen stronger office recovery from lower vacancy bases, which makes them attractive to investors chasing yield spread.
Where Sydney stands apart is industrial infill scarcity. Sydney’s inner-ring industrial vacancy is considerably more acute than Melbourne’s outer-ring equivalents. Furthermore, Sydney’s premium entry prices mean LVR calculations leave less room for valuation shortfall — a factor that matters considerably more here than in lower-priced markets.
From a finance perspective, one thing I’d specifically emphasise is that Sydney lenders maintain unpublished postcode exposure limits that aren’t visible on any rate sheet. Understanding which lenders have capacity in which Sydney precincts — and which have quietly pulled back — requires a broker with active panel access and current Sydney transaction history. That’s a meaningful difference from simply applying through your bank.
What LVR can I get on a Sydney commercial property?
Typical LVR ranges in Sydney are 60–75% depending on asset type, borrower profile and lender. That’s a wider range than many people expect — and the difference between 60% and 75% LVR on a $3M asset is $450,000 of equity. Getting lender selection right genuinely matters here.
As a general rule, owner-occupiers consistently attract the most favourable LVR terms, often reaching 70–75% across healthcare, professional services and light industrial. Investment-grade industrial in South Sydney and the south-western corridor is currently achieving 65–70% LVR from multiple lenders. Medical premises with strong tenants are similarly well-supported.
In contrast, CBD strata office is the most challenging sector for LVR right now. Lender appetite is narrower and, in a meaningful number of transactions I’ve been involved in, valuations are coming in short of the purchase price. If you’re buying in this segment, building in a genuine equity buffer — not just meeting the minimum — is sound practice. For full LVR ranges by sector, see our Sydney commercial property loans page.
Which Sydney precincts are performing best for commercial property in 2026?
For office, Parramatta is the standout non-CBD market nationally — vacancy is running well below the Sydney CBD average and the Metro West tailwinds are real. Businesses are actively relocating westward, which is anchoring demand in a way that other suburban office markets haven’t managed. North Sydney is also improving sharply following the Victoria Cross Metro station opening in August 2024 — that precinct was oversold on the negative side and is now repricing.
For industrial, South Sydney and Inner West infill assets are among the tightest in the country right now, with virtually no supply pipeline. Additionally, Western Sydney industrial is the longer-term story, driven by the airport and the Aerotropolis precinct reshaping the logistics geography of greater Sydney. Current vacancy figures for both sectors are in the tracker above.
On the other hand, CBD strata office and non-anchor retail remain the weakest performers across virtually every Sydney precinct — and that’s reflected in both lender appetite and valuation outcomes. Medical and healthcare assets, however, perform well across most precincts due to strong tenant covenants, essential-service demand, and consistent interest from SMSF investors. If you’re unsure which precinct best suits your asset type and finance profile, that’s exactly the conversation I’d encourage you to have before signing a contract.
What is the Sydney commercial real estate investment outlook for 2026?
The most important thing to understand about Sydney commercial real estate investment in 2026 is that it’s not one market — it’s several, moving in quite different directions. Industrial and logistics assets continue to attract the deepest pool of investors, supported by structurally low vacancy (see the tracker above) and a supply constraint that isn’t going to ease quickly. Medical and healthcare commercial property is similarly compelling — yield compression has moderated from the 2021–22 peak, which gives buyers a more realistic entry point without losing the income security that drives that sector’s appeal.
Office investment in the Sydney commercial real estate market is more selective. Prime CBD assets with long WALE and committed tenants are transacting, but the lender and buyer pools are noticeably narrower than they were. CBD strata office and secondary-grade assets require careful positioning on both price and structure. Meanwhile, discretionary retail remains the weakest investment category across the board — anchor-tenanted neighbourhood centres hold up considerably better than regional or discretionary-dependent strips.
The rate environment is the key variable right now. With borrowing costs elevated relative to the 2021–22 lows, yield spreads are thinner and assets need to be acquired at the right price for the numbers to work. The deals I’m seeing go unconditional are the ones where buyers have done genuine due diligence on income quality and confirmed finance terms before committing — not after.
What are typical cap rates in Sydney’s commercial property market?
Cap rates (capitalisation rates) in Sydney are the most compressed of any Australian capital city — meaning you pay more per dollar of net income than you would for a comparable asset in Brisbane or Perth. That compression reflects Sydney’s market liquidity, tenant quality, and long-run capital appreciation track record. For investors who understand those fundamentals, it’s a deliberate premium. For those who don’t, it can be a trap.
Current sector-by-sector cap rate ranges are in the yield tracker above, reviewed quarterly from active transactions. As a general rule, medical and industrial assets sit at the tighter end of the range; CBD strata office and mixed-use assets sit at the wider end. These vary meaningfully by precinct, lease term, tenant covenant and asset quality — the tracker gives you the midpoints, not the extremes.
What I’d specifically flag for buyers: lenders apply their own cap rate assessments as part of the valuation process, and these don’t always align with the acquisition cap rate. A deal that appears to stack up at purchase can become difficult if the lender’s valuer applies a wider cap rate in their assessment. This is one of the most common reasons commercial finance falls over in Sydney — and it’s precisely why understanding the current valuation environment, before you sign a contract, is so important.
Can I buy Sydney commercial property through an SMSF?
Yes — and Sydney is the market where I see this structure used most frequently. An SMSF can borrow to purchase commercial property using a limited recourse borrowing arrangement (LRBA), provided the fund has sufficient assets and the acquisition meets the sole purpose test and other superannuation compliance requirements. It’s not a complicated structure once you understand it, but it does require lenders who specialise in it.
The advantage that most people don’t fully appreciate upfront: your SMSF can lease the commercial premises directly back to your own business at market rate. This is one of the few related-party transactions explicitly permitted under superannuation law — meaning your business’s rent payments flow into your super fund rather than to an external landlord. Over a 10–15 year period, the tax treatment (15% on rental income in accumulation phase, potentially zero in pension phase) makes this an exceptionally efficient structure for business owners who plan to hold for the long term.
For Sydney assets, SMSF commercial property loans typically operate at 65–70% LVR, with lender appetite strongest in industrial, medical and professional services premises. CBD strata office is more challenging under an SMSF structure, for the same valuation sensitivity reasons that affect that sector generally. Not all lenders on my panel offer SMSF lending — it’s a specialist area, and early conversation is essential. See our SMSF commercial property loans page for more detail.
How does the Western Sydney industrial property market differ from inner Sydney?
They’re fundamentally different markets in terms of who’s buying, what they’re paying, and what lenders will do — and understanding that distinction matters before you make an offer. Inner Sydney industrial — South Sydney, Inner West, Alexandria, Botany — is a pure infill market. There is virtually no new supply, vacancy is among the lowest in the country (see tracker above), and assets here are fought over by owner-occupiers who need proximity to the CBD and investors who want that supply constraint locked in permanently. Lenders are very comfortable with these assets as a result.
Western Sydney industrial property, on the other hand, is a growth story rather than a supply-constrained one. The Western Sydney Airport (Badgerys Creek) and the broader Aerotropolis precinct are fundamentally reshaping the logistics and warehousing geography of greater Sydney. Large-format assets, modern construction, and long leases to national tenants characterise this market. Yields are consequently slightly wider than inner Sydney, reflecting the longer-run nature of the growth thesis and the greater distance from established demand centres.
From a lending perspective, both sub-markets are well-regarded. Western Sydney assets with long WALE and national tenants attract strong lender interest across my panel. The meaningful difference is that inner Sydney strata industrial — smaller units, multiple owners, shared common areas — can be trickier to finance than freehold Western Sydney assets, particularly where the strata plan is older or where there are owner corporation complications. That’s a structural issue worth raising with your broker before you commit.
The divergence between office and industrial vacancy tells the whole story of Sydney’s commercial market conditions right now. Industrial vacancy sitting below 3% — well under the 4% equilibrium threshold — means rental income continuity is strong, valuations are well-supported, and quality assets in the right precincts are attracting genuine buyer and lender competition.
CBD office vacancy at 13.8% is a different environment — primarily supply-driven rather than demand-driven, which means prime assets with committed tenants are performing well while secondary and strata grade face sustained pressure on rents and valuations. For buyers, this translates directly to a narrower lender pool and the need for careful asset selection based on quality and precinct.